Nifty has made new 52 weeks high by breaking out the range. Technically Indian market is bullish as well as overbought also. All indicators indicate Nifty’s high momentum. Now big question is that what is the resistance of the Nifty for this week? We know the support of the Nifty. But now we can not see the resistance of the Nifty of this week. Gann Fan can give an idea of the resistance which is 5440 (As per marketcalls blog) but I think it does not give the specific resistance of the Nifty.
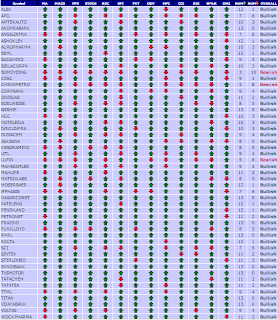
Few indicators still indicates the trend change scenario of Nifty. I do not know How much true it is. But my past experience is telling me to think about these indications. I am giving the picture file of these indicators.
Nifty has made huge bearish CRAB Pattern.
6/100 Historical Volatility started to increase despite of being in bullish zone.
Nifty is in overbought zone.
Tomorrow first hour may be positive but traders can short Nifty at the levels 5392 to 5398 if it is unable to sustain above 5400 or 5411 and hold it if it closes below 5335. otherwise cover it.
Those are not comfortable with Nifty, they can trade with the midcap stocks as per its support and resistance which are given below:
Courtesy : profit indicators.
The main objective of my posting is to save my readers from bull's trap.
If nifty's monthly closing is above 5310 then target of the Nifty may be 5806 in the next three months.(This is only prediction, do not fully depend on it)


No comments:
Post a Comment